Leave No Location Behind - iSEE* The Arab World
*Integrating Society, Economy, and the Environment
Inputs to UN-Space publication 2022: The Geo-Statistical Laboratory - ESCWA Statistics
From Lab to Policy and Society
"What we need to change: Measure and value the things that matter in people's daily lives"
(UN Emerging Narrative for Our Common Agenda, June 2021).
Leaving no one behind requires data on the "what", the "when", and the "where". Statistical data tend to address the "what" and the "when". Geospatial data address the "where". Together these dimensions of data help measure the things that matter in people's daily lives. There has been a growing interest in the "where" dimension of statistics since visualizing location-based statistics provides policymakers with a better context over spreadsheets and charts.
The availability of geocoded statistics in the Arab region is increasing. Against this backdrop, the Statistics, Information Society, and Technology Cluster at ESCWA has initiated the Leave-No-Location-Behind Canvas to consolidate Arab Geo-Statistical data. The objective is to extend the synthesis, analysis, and visualization of statistics; from Arab streets and neighbourhoods to Arab cities and states. The Geo-Statistical laboratory at ESCWA Statistics is operationalized and supported by the Leave-No-Location-Behind Canvas. The laboratory has so far collated and consolidated over 90 layers of "anything-anywhere" Arab geo-statistical data available in the public and open-source domains. These layers of geo-statistical data are being reconciled; rendered fit-for-use and fit-for-purpose, to disseminate a new breed of iSEE indicators (Integrating Society, Economy, and the Environment).
This Geo-Statistical laboratory is the breeding ground for the cross-pollination of geo-enabled statistics on the region. The pollinated outcomes will be published under quarterly releases, with the first release planned for March 2023. The ensuing quarterly publications will be collated and updated under ESCWA's new online flagship publication: The Geo-Statistical Atlas of the Arab World. The Atlas provides the dashboard for measuring, gauging, and valuing "the things that matter in people's daily lives".
With technical support from ESCWA's Information, Communication and Technology Section, the core of the Geo-Statistical Atlas will be pivoted on a smart search engine leveraging machine learning towards a conversational, natural, personalized, and responsive searches that would intuit what policy makers or end users are looking for.
The Geo-Statistical Atlas is in line with the UN Secretary-General's Data Strategy to meet the current and future needs of member States for user-centric, geo-enabled, evidence-informed decision-making.
For more information on the innovations, solutions, research, development, and demonstration activities of the Geo-Statistical Laboratory at ESCWA Statistics, communicate with the Leave No Location Behind - iSEE the Arab World canvas project team
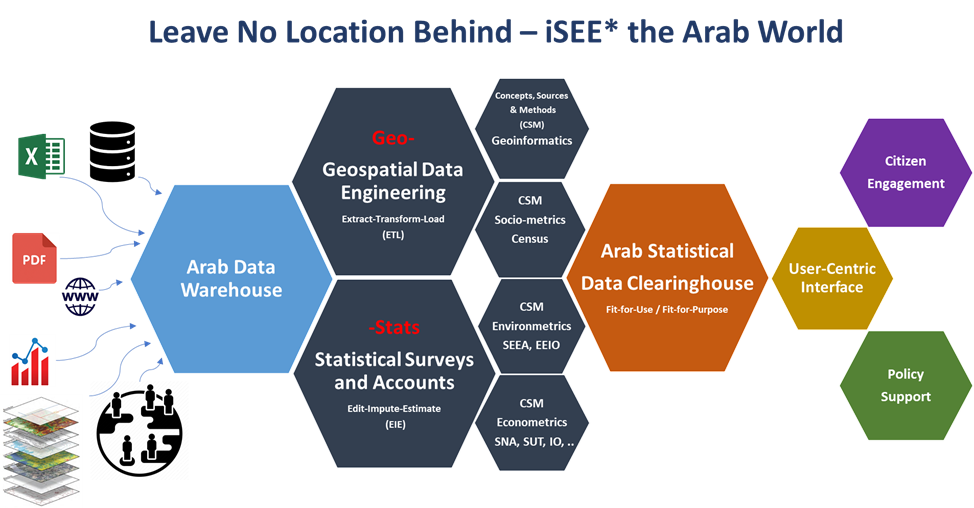
Leave No Location Behind - iSEE* the Arab World: Conceptual Diagram

Leave No Location Behind - iSEE* the Arab World: Quarterly geo-statistical releases towards the Geo-Statistical Atlas of the Arab World
Leave No Location Behind - iSEE* The Arab World
*Integrating Society, Economy, and the Environment
Aggregated Land Cover Change, Arab Region, Annual Trend Analysis, 1992 - 2020
By
The Geo-Statistical Laboratory - ESCWA Statistics
From Lab to Policy and Society
Introduction
One of the low-hanging fruits of the Leave No Location Behind canvas is an indicator on land cover change. Land cover change is a surrogate measure for gauging the degree of decoupling between economic and ecological potential capacities of natural resources. Aggregated Land cover across the Arab region (twenty-two Member States) is processed to detect change in land cover classes. The aggregation is conducted on the original multi-land cover classes of https://cds.climate.copernicus.eu. The aggregated land cover classes used in this study are 1) Built-up area, 2) Agriculture-crop, 3) Inland water, and 4) Natural cover. The estimates provided are examples showcasing an early and initial output from the Geo-Statistical Laboratory at ESCWA Statistics.
Methodology
Both cross-sectional analysis (1992 versus 2020, see Table 1, and Map 1) and time-series analysis (1992 to 2020, see Figures 2, 3, 4, and 5) are conducted to estimate land cover change across the Arab region. Raw data are obtained from https://www.esa-landcover-cci.org, as mid-resolution pre-processed data (300x300m), and post-processed via QGIS and ESRI's ArcGIS Pro. The advantage of time-series analysis over cross-sectional analysis is on the ability of the former to produce statistical confidence intervals on the estimates, while the latter provides a snapshot of the estimates. The script for non-parametric regression and trend analysis is borrowed from the Finnish Meteorological Institute. The script detects and estimates trend in time-series of annual values for distribution-independent regression. The statistical methods used are the nonparametric Mann-Kendall test for testing the presence of the monotonic increasing or decreasing trend and the nonparametric Sen's method for estimating the slope of a linear trend. The Mann-Kendall test requires at least 4 values and the calculation of the confidence intervals for the Sen's slope estimate requires at least 10 values in the time-series. These threshold limits are satisfied in the current analysis.
Results
Based on the cross-sectional analysis (1992 versus 2020), the built-up area in the Arab region has increased from 12,418 km 2 to 32,365 km 2. Most of this increase is due to the conversion of natural land cover (11,631 km 2) followed by agricultural-crop land cover (8,154 km 2) and Inland water cover (162 km 2) to built-up areas. Table 1 highlights the transition matrix of four aggregated land cover classes across the Arab region. The aggregation is conducted on the original multi land cover classes (see https://cds.climate.copernicus.eu/cdsapp#!/dataset/satellite-land-cover?tab=overview) to four classes; 1) Built-up area, 2) Agriculture-crop, 3) Inland water, and 4) Natural cover.
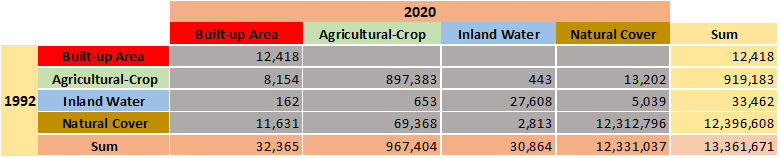
Table 1: Land Transition Matrix, Arab Region, 1992 versus 2020.
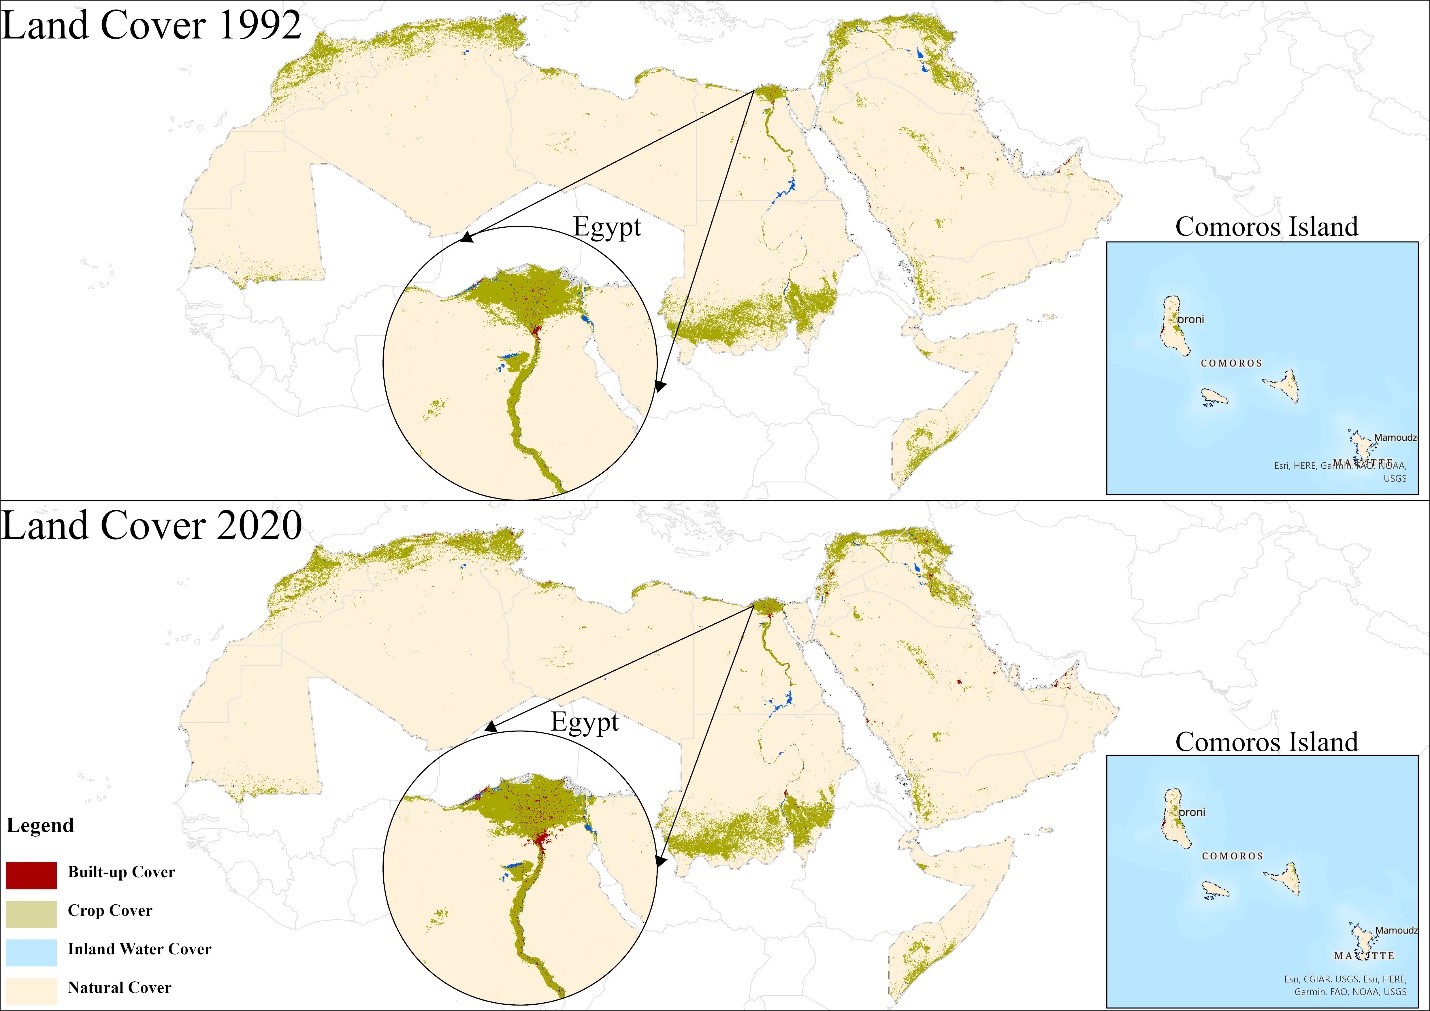
Map 1: Land Cover Change 1992 versus 2020 (twenty-two Member States) Please click here to view the map as an ArcGIS ESRI StoryMaps with dynamic swiping and zooming
Based on the time-series analysis (1992 to 2020; 29 years time span, see Table 2), the increase in the total built-up area across the Arab region (see Table 2 and Figure 2) is estimated to be between 550 km 2 and 648 km 2 per year (95% confidence interval). This rate is approximately equivalent to the size of the Island of Bahrain in area equivalency. In other words, the annual expansion rate of the built-up areas in the Arab region is metaphorically equal to converting one Bahrain Island per year in area-equivalency from natural and semi-natural landscapes (such as barren land, inland water, and agricultural land) to artificial landscapes (i.e., built-up areas).
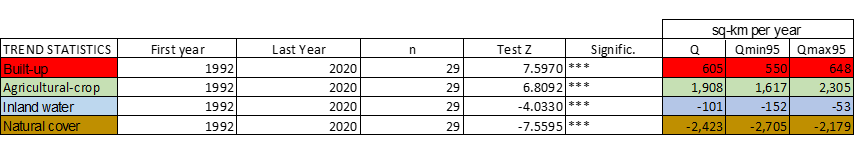
Table 2: Time series analysis, non-parametric regression, land cover, Arab Region, 1992 to 2020.
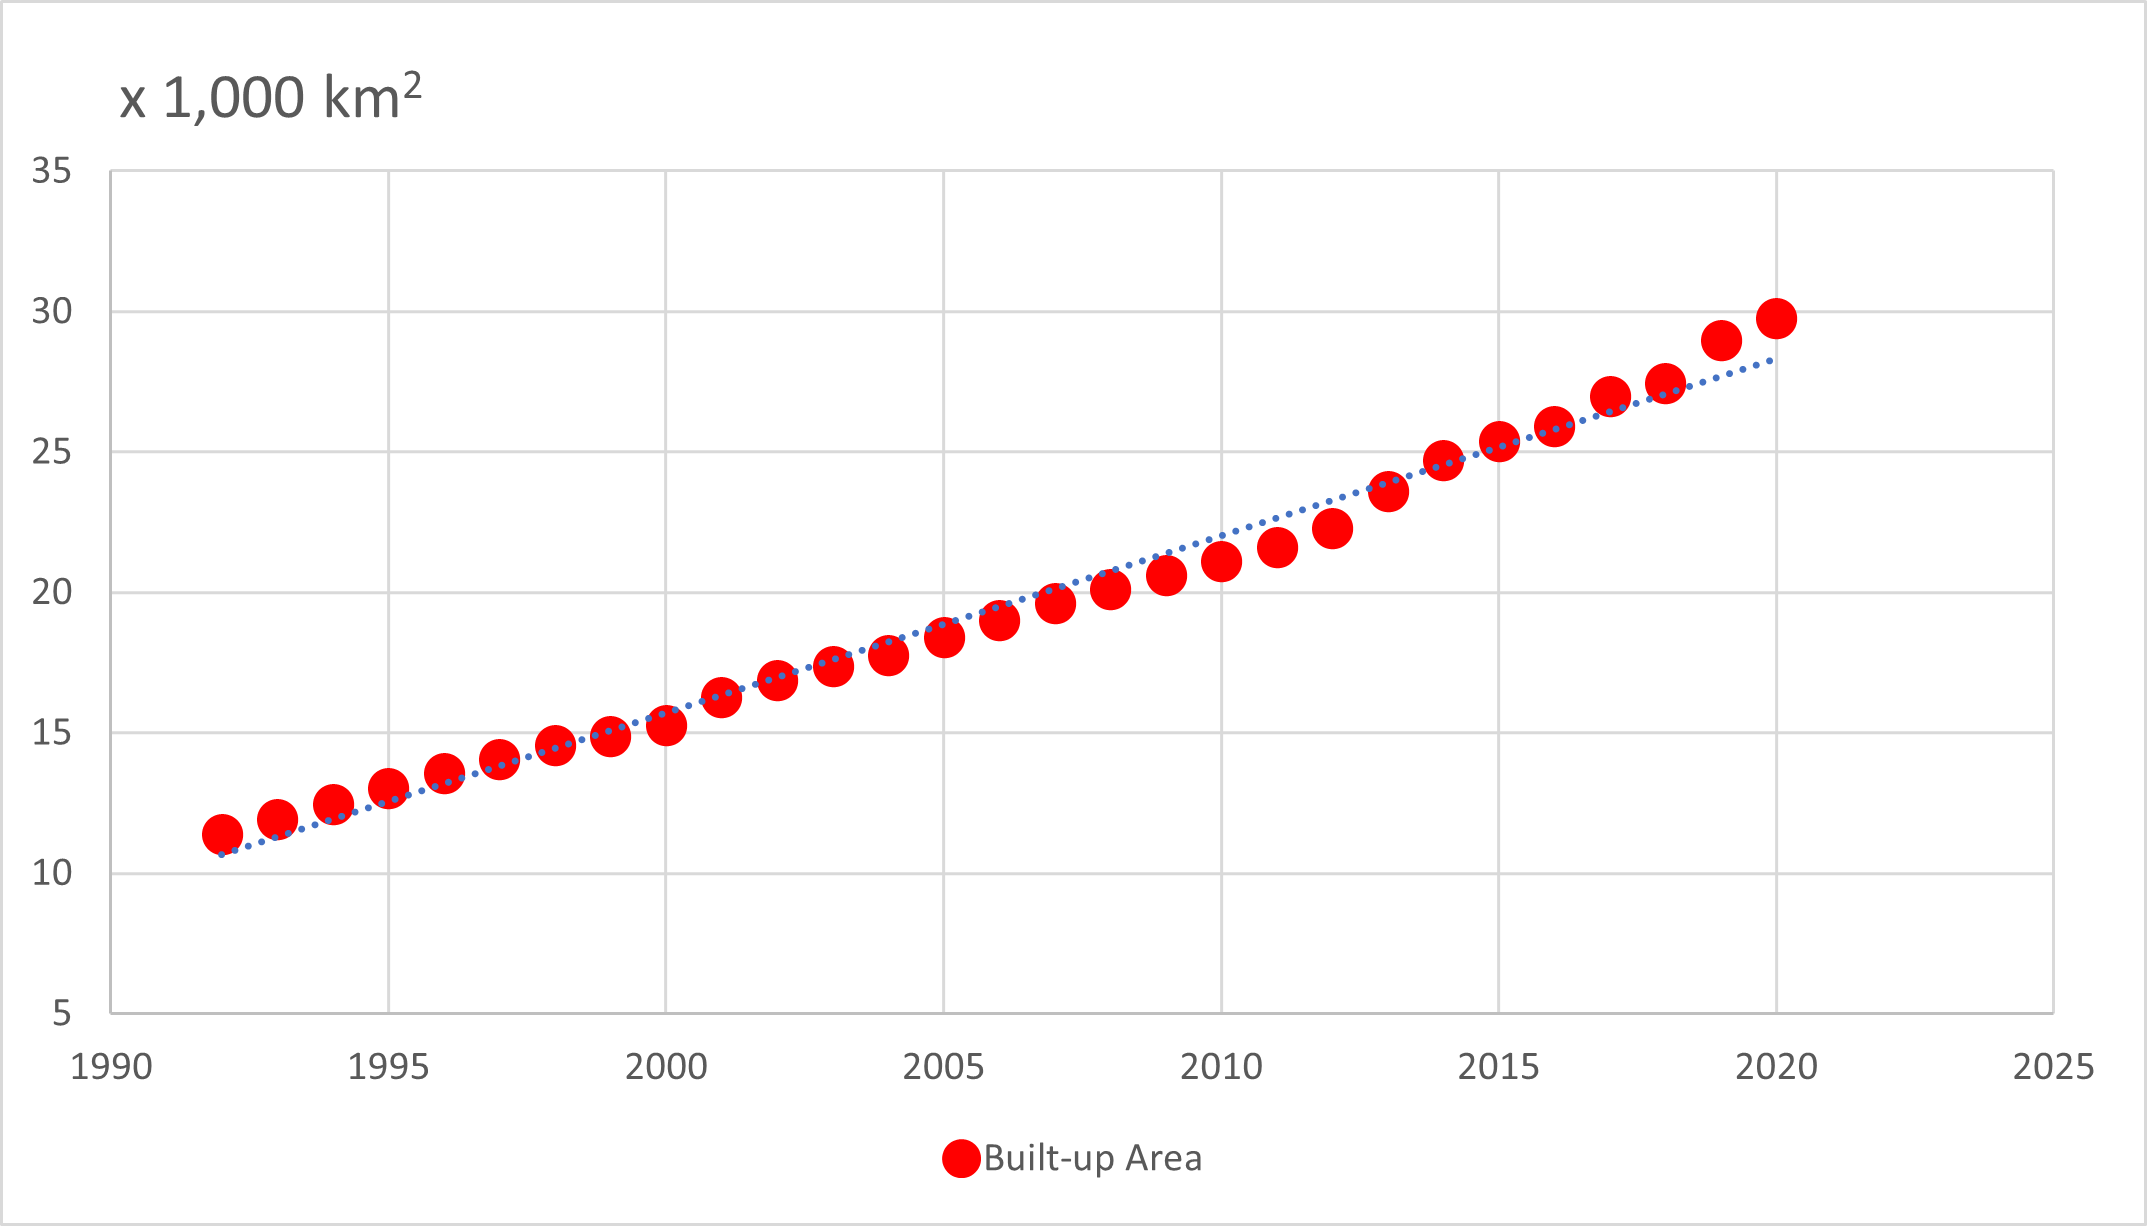
Figure 2: Built-up area, time series analysis, rate of change in km 2/year, Arab Region, 1992 - 2020.
Correspondingly, the increase in total agricultural-crop cover across the Arab region (see Table 2 and Figure 3) is estimated to be between 1,617 km 2 and 2,305 km 2 per year (95% confidence interval). This annual expansion rate is approximately equivalent to the size of the capital city Amman, Jordan in land area equivalency.
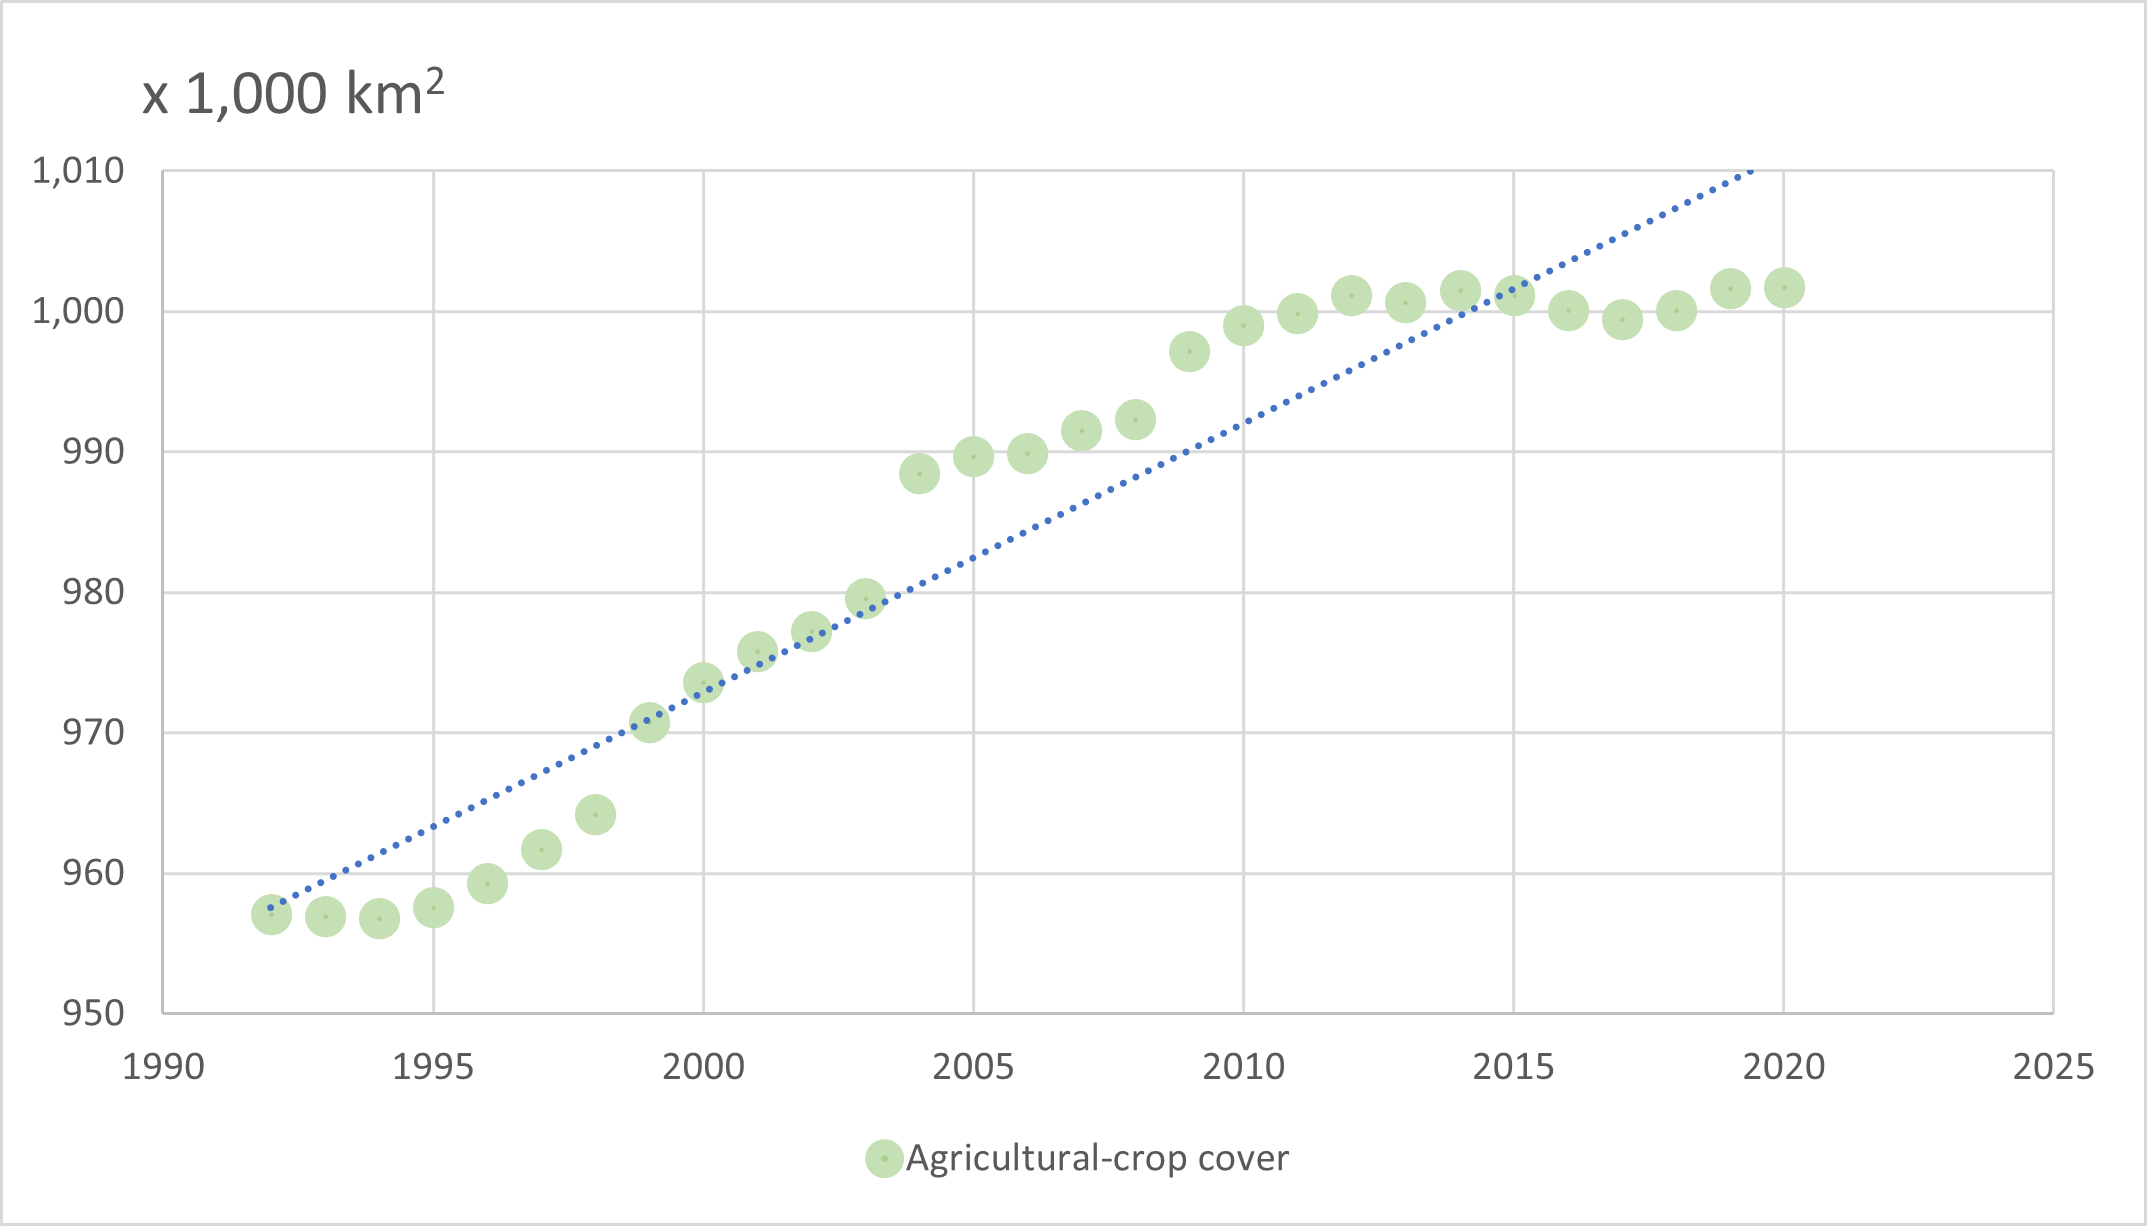
Figure 3: Agricultural-crop cover, time series analysis, rate of change in km 2/year, Arab Region, 1992 - 2020.
On the other hand, the decrease in the total area of inland water cover across the Arab region (see Table 2 and Figure 4) is estimated to be between 53 km 2 and 152 km 2 per year (95% confidence interval). This annual decrease is approximately equivalent to the size of Dubai City (UAE). Similarly, the decrease in the total area of natural cover (such as barren land and tree cover) across the Arab region (see Table 2 and Figure 5) is estimated to be between 2,179 km 2 and 2,705 km 2 per year (95% confidence interval). This annual decrease is approximately equivalent to the current area of the capital city, Cairo, Egypt.
Conclusions
Based on mid-resolution satellite data (300x300m), between 1992 and 2020, the ecological potential capacity of natural landscapes (such as barren, tree cover and inland water) across the Arab region has depreciated at a rate equal to the current area of Cairo and Dubai combined, year over year.
The above trend estimates are based on nonparametric regression on 29 annual data points. The Statistical intervals exclude the reported remote sensing processing accuracy of 75% on land cover type, classifications and identification. The actual interval estimates should thus be wider. Such estimates shed light on the ecological potential capacities of landscapes and their sustainability across the Arab region. The Geo-Statistical Laboratory at ESCWA Statistics is conducting detailed analyses on land-cover and land-use mapped over socio-economic statistics and coupled with a suite of environmental, geographical and location-based attributes towards disseminating a new breed of geo-statistical indicators for the Arab region, from Arab streets to Arab States using higher resolution data with related national and regional statistics.
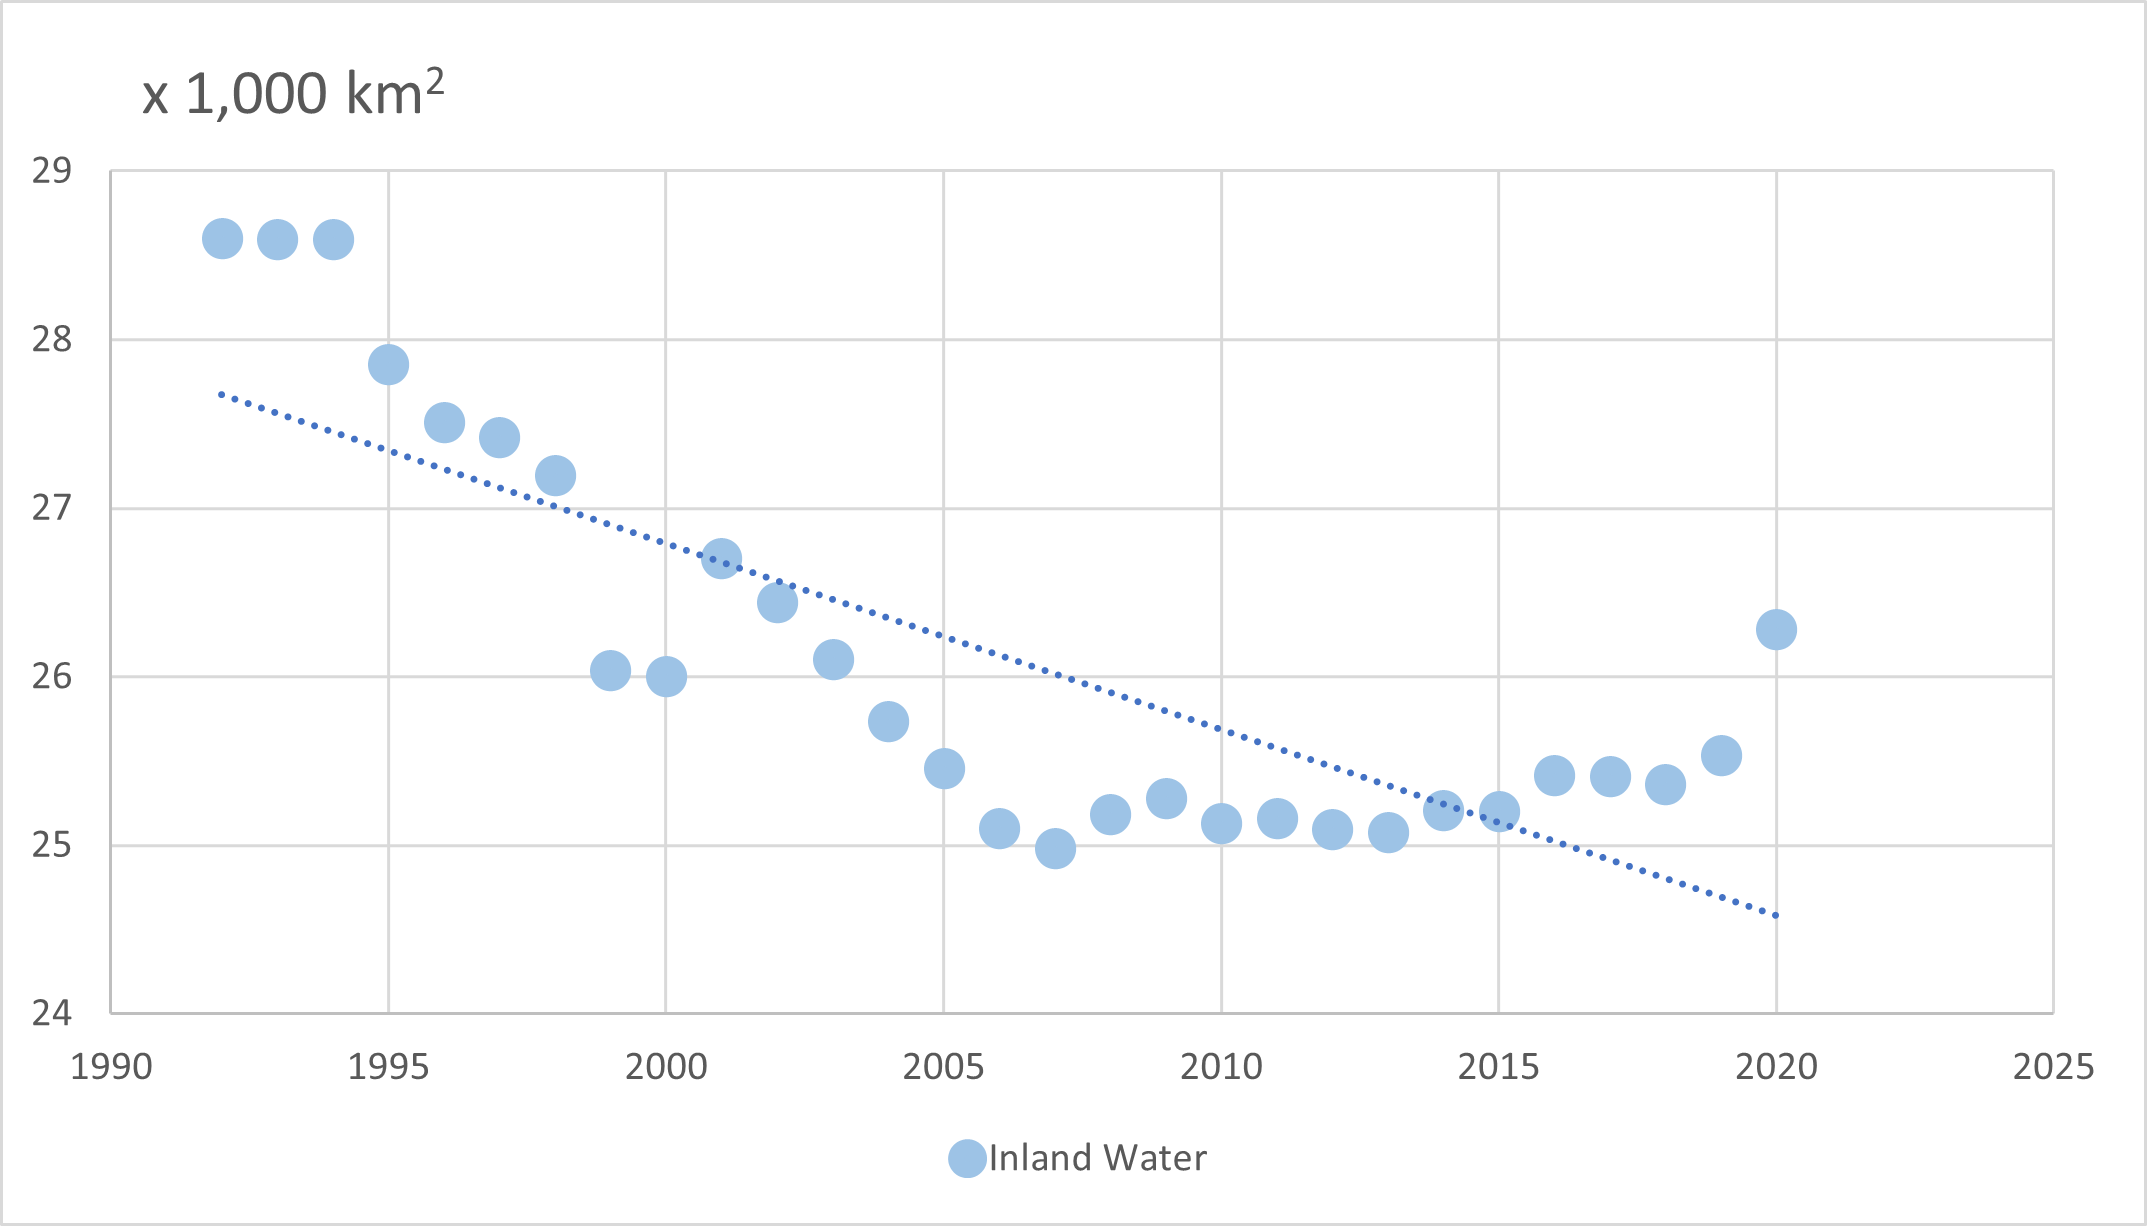
Figure 4: Inland water cover, time series analysis, rate of change in km 2/year, Arab Region, 1992 - 2020.
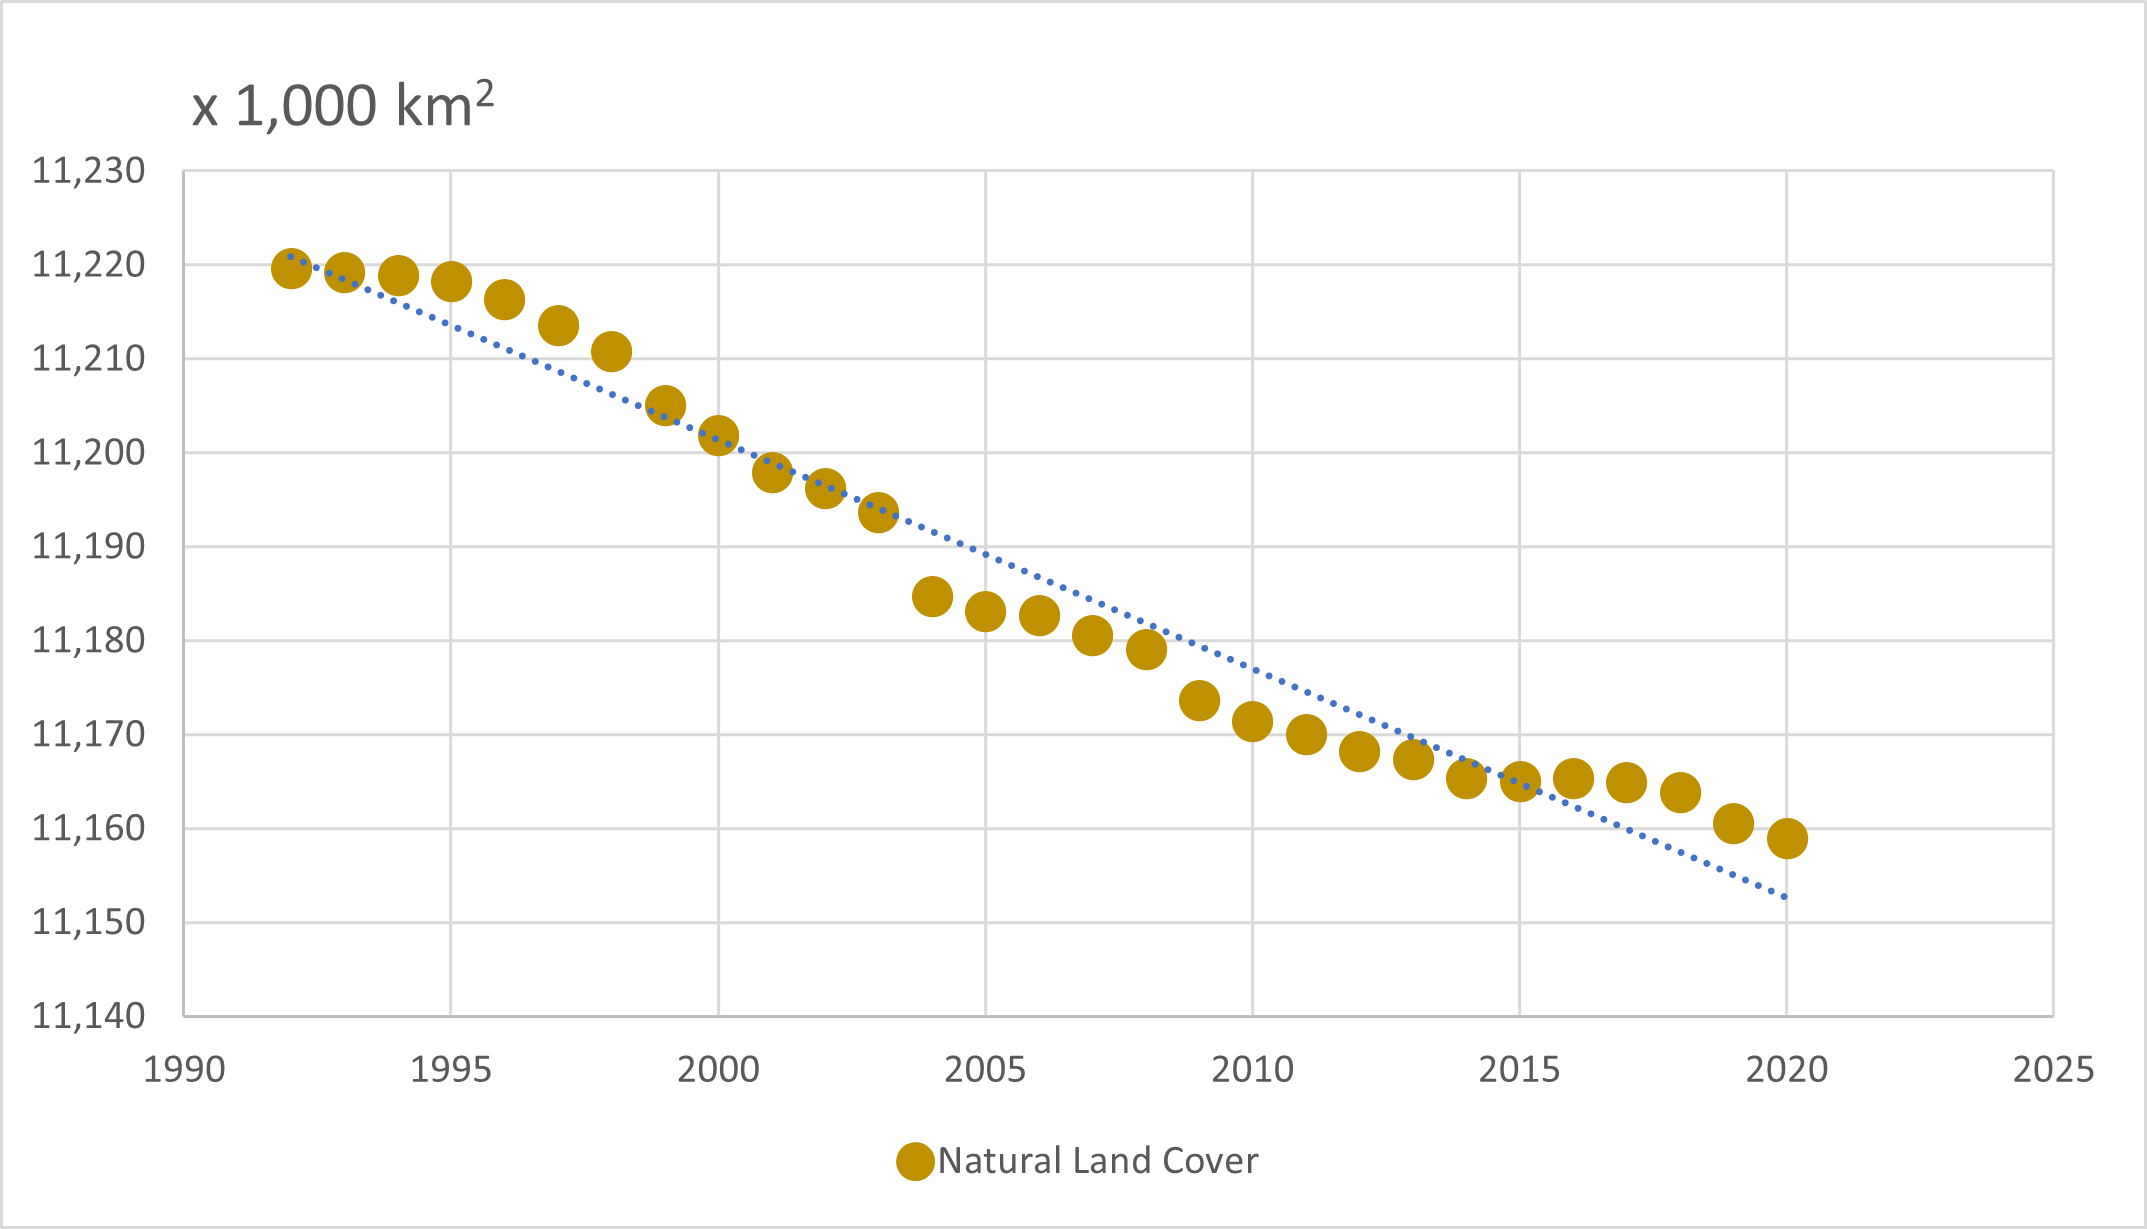
Figure 5: Natural land cover, time series analysis, rate of change in km 2/year, Arab Region, 1992 - 2020.
For more information on the innovations, solutions, research, development, and demonstration activities of the Geo-Statistical Laboratory at ESCWA Statistics, communicate with the Leave No Location Behind - iSEE the Arab World canvas project coordinator Dr Soheil Rastan, P.Eng.
Limitations
The latest official UN boundary map used for the Arab region does not include a number of the artificial islands constructed on shoreline reclamations (examples: Artificial Islands in Bahrain and UAE). Respecting the latest UN official boundaries, this case study did not include such additions. These additional artificial islands will be added in the future as extensions, pending official UN approval. Such extensions alter the extent of land cover change and the decoupling between economic and ecological potential capacities of natural resources.
Acknowledgments
The advocacy and the support of Dr Haidar Fraihat, the Cluster Lead responsible for Statistics at ESCWA has been paramount for the establishment of the Geo-Statistical Laboratory. The support of the IT team led by Mr. Ahmed Al-Awa, the Chief of ESCWA's IT, is greatly appreciated. The diligent and tireless contributions of Dr Amal Iaaly, Director of the GIS Center at the University of Balamand, Lebanon and the GIS Expert Consultant to the Leave No Location Behind project at ESCWA, are ardently acknowledged. In addition, the remarkable contributions of the following individuals to the available concepts, sources and methods are recognized (in alphabetical order): Aahlaad Musunuru (ESCAP), Abd Salam El Vilaly (ESCWA), Charbel Abou Chakra (UN-Habitat), Christoph Rouhana (ESCWA), Ghina Koteich (ESCWA), Liliane Nassr (ESCWA), Mattia Marconcini (German Aerospace Center), Mohamad Hossary (ESCWA), Nanor Karageozian (UN Habitat), Rami Zaatari (ESCWA), Thomas Esch (German Aerospace Center), and Zeina Sinno (ESCWA).